At Fusebox, we’re in the business of making things amazing to look at and use. If your users can’t enjoy the things we create using the tools they have right now, we haven’t done our job.
That’s where Flash 3D comes in. You’ve heard of it, no doubt, but here are a few things you might not know:
Adobe Flash is installed on 99%+ US personal computers
Flash is one of the standard plug-ins developers use to show more expansive, rich content
Flash is a desirable web format for games, applications, video, advertising, and interactive content. In fact, Flash 3D is being used more and more in the development of the next generation of online games and websites to create more engaging graphics and experiences
Flash is capable of creating content for iPhone, Android and many other mobile devices
Click the grid button to toggle between a 3D sphere and grid view
While an open standard for 3D content for the web may take years to be created and adopted, for now, Flash 3D is one of the most available, supported solutions that can be displayed in browser.
In fact, the upcoming Flash Native 3D library (code-named “MoleHill”) is capable of utilizing the GPU (or the video card) to process a thousand times more information than the computer processor or software rendering is capable of.
We welcome you to get in touch with our team to get started on your interactive project—and find out if Flash 3D might be the right solution for your needs.
You may have heard of the Golden Ratio before and how it’s geometry is aesthetically pleasing. A couple of days ago, we had our own special geometry to solve. Our Creative Director Steve Newman @moodyjive came to me with a challenge. He was designing a compound shape and wanted to divide it into equal parts. He was currently eyeballing it, but something just didn’t feel right about that technique to him. As the perfectionists we are here at @fusebox, I’d thought I could lend a hand or a pencil if you will. I told him we’d solve this with closed form mathematics as his object was simply made up of a combination of circles and rectangles. Quite the skeptic, Steve handed over the problem to me.
The object he wanted to divide, first into 4 equal slices and then 3 equal slices, is pictured below. Here’s the problem statement in words.
Given a fixed outer radius of the arc , a fixed inner radius of the arc , and a fixed height of the pillar , determine the slicing point angle from the horizontal such that we will have four equal areas. Our slice is defined as the angle in degrees but in geometry it’s often more convient to work in radians because it directly relates the length of an arc to a radius and works great in equations. For those that don’t remember or don’t know, 360 degress is equal to 2 radians.
First Four equal parts.
Since we have vertical symmetry, we can just use the left side of the inverted U noting the vertical cut is necessary. The area of a complete donut is simply described as the area of a circle with radius minus the area of a circle with radius of . We then need to divide the area of a complete donut by the ratio of the arc length of the inner radius of . Recalling high school mathematics, the arc length is simply a radius multiplied by the coverage angle in radians or simply . This proportion of entire area of a circular arc is simply the arc length divided by the circumference of the cirle or . Notice that the proportion is equal 1/4 the area of a circle when the angle is zero.
Therefore the arc area:
The area of the rectangular pillar of height is then the area of the rectangle with thickness and height of plus the area of the complementary arc that sweeps through .
What we need to do is solve for when we set . Expanding the equations, and then group by one can readily show the solution is:
When we substitute his values , we find that is 0.47771 radians or degrees.
Note: because we relied on symmetry, the equation is valid for between and degrees only.
The math for dividing into three (3) equal areas is quite similar and left as an exercise to the reader, We’re calling the angle . Here’s the sketch. Put your answer in the comments if you dare for the same geometry. I’ll post our answer on Friday. 🙂
UPDATE: 7/26/2011
Given the same geometry, our angle is 48.247 degrees.
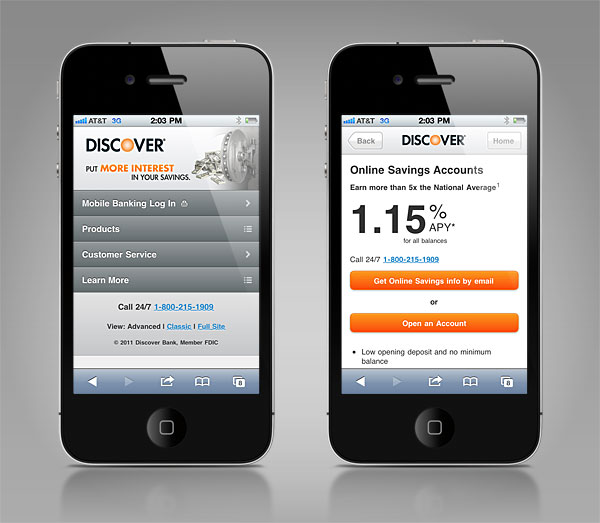
The Discover Mobile Banking Site provides a targeted destination for mobile traffic generated primarily via organic and paid search. While Fusebox designed the mobile banking site specifically for Discover Bank, the framework actually scales seamlessly across all Discover properties.
The Discover mobile banking site was developed using a combination of Javascript and a set of core web services implemented via JSON. JSON was the first choice for a couple of key reasons:
It’s more readily parse-able by Javascript.
It’s lightweight.
We’ve been able to implement the ‘P’ specification and can therefore call services without a proxy. (The utility of this in certain environments shouldn’t be underestimated!).
The Discover mobile banking site communicates with the RESTful Discover Interest Rate Service to support real-time interest rate feeds. Further integration with the Discover email system enables asynchronous messaging directly to customers who might prefer to review additional information on their time, or open an account later.
The Discover mobile banking site was designed and optimized for smartphones—more specifically, the iPhone, Android and Blackberry platforms. All other mobile device traffic is redirected to an older style feature phone user interface, reminiscent of 1995. And as always, the Fusebox team worked closely with the Discover Bank team on all aspects of the mobile project, from studying best practices and emerging standards, to a careful analysis of mobile traffic across the Discover properties (it’s been doubling every quarter!), through to the web server rewrite strategy that implements business rules around mobile detection and redirection at the request header level.
The Discover mobile banking site launched on-time, and was a huge success—all thanks to great teamwork and collaboration by everyone involved.
And if you’re looking for a great Savings Account that is over 5X the National Average1, the Discover Mobile Banking Site is your best place to get started!
1 The APY for the Online Savings Account as of May 31, 2011 is more than 5 times the national average APY for interest-bearing savings accounts with balances of $500 as reported by Informa Research Services, Inc as of May 31, 2011. Although the information provided by Informa Research Services has been obtained from the various institutions, the accuracy cannot be guaranteed. Rates are subject to change at any time.
“It’s all the same to be, when I’m driving free, the worlds my home when I’m mobile”
40 years after Pete Townsend sang those immortal words on arguably The Who’s best album, we’re finally untethered from our desktops and we are truly @home on the Internet. To us, the Golden Age of Mobile Computing began with the first release of the iPhone 3 in June of 2007 and this year is proving to be shattering mobile expectations.
At Fusebox we’ve been aggressively building out our mobile practice. Like many in our industry, we recognize momentum in the overalll device market now favors smartphones and tablets. Ubiquitous computing is led by devices running Google’s Android operating system and Apple’s iPhone (iOS). In fact, projected smartphone usage in the US will reach 73.3 million by the end of 2011. This represents 31% of the total mobile user population. By 2013, this number is expected to more than double.
Currently, a minority of mobile users, specifically smartphone users, command the majority of attention from developers and marketers simply because of how they use their devices. Unlike feature phone users, these users actively engage with the mobile web, yet the user interfaces needed to properly address their needs often consist of:
an amalgam of custom solutions that lack standardization across the enterprise,
must constantly be tested,
and are costly to develop and support.
In the mobile space, there are often multiple codebases in order to deal with this lack of standardization.
The US mobile browser market at this moment appears to be a three-way race between Safari, Blackberry, and Android, with the latter behind but showing the fastest growth. The important news to recognize is that with Blackberry’s move to the WebKit browser in its 6th generation O/S, is that the WebKit browser represents over 65% of the mobile smartphone browser market. In turn, Windows devices and others are playing catch up and could shift the market if they can come up with some radical innovation.
Safari 26%
BlackBerry 20%
Android 30%
Other (including Windows, webOS and others) 24%
It’s important then to implement a mobile web initiative in a consistent web framework. This is different, yet complementary to a mobile application development framework which we’ll discuss in another post (ie an iPhone or Android app). The most promising framework we’ve implemented is JQuery Mobile.
In order to form a unified mobile experience, that can easily deploy features and functionality, we @fusebox now leverage a touch user interface framework that seeks to monitor and deploy solutions that track against the product road maps of the popular browsers and operating systems as well as cover the remaining 35% in a both a cost-effective and useful way.
The JQuery Mobile solution we integrate seeks the goal of “One Codebase, all Mobile Platforms”. For those of us who have and continue to experience the effects of the “browser wars” and the large amounts of coding and recoding necessary to address each user interface/browser combination, the solution is a more than welcome one.
The JQuery Mobile platform seeks to address the following mobile operating systems to accommodate a consistent application programming interface and a small footprint. To business owners, this is distinguished as a) easy maintenance, b) consistent user experiences and c) fast user downloads. The platforms addressed by JQuery Mobile include:
iOS (Apple)
Android (Google)
Blackberry (Blackberry)
bada (Samsung)
Window Phone (Microsoft)
palm webOS (Palm/HP)
symbian (Nokia)
MeeGo (Open Source)
Why go with a solution from JQuery? Well, quite simply, JQuery has revolutionized the way in which javascript has been used on the web and shows no sign of slowing down. Not coincidentally, the latest statistics reveal that JQuery is by far the dominant javascript framework. At the time of this post it is used by over 30% of all websites. The next closest JS framework has a market share of less than 6%. An introduction of the JQuery Mobile framework, which is built upon the JQuery core is then a natural progression. JQuery project sponsors include:
The Filament Group
The Mozilla Corporation
Palm
Blackberry
Nokia
Device Atlas
Adobe
dotMobi
From a technical perspective the framework offers branded experiences through consistent theming frameworks ensuring sites do not need to be cookie cutter interfaces yet will offer similar experiences across platform. This allows web developers to focus on features, functionality, user interface design and content as opposed to worrying about accessibility and inconsistencies across devices. This often takes up to 50% of the level of effort in developing a mobile initiative along with the corresponding maintenance and upgrade headache.
The framework also satisfies the concept of ‘progressive enhancement’ which is a “strategy for web design that emphasizes accessibility, semantic HTML markup, and external stylesheets and scripting technologies. Progressive enhancement uses web technologies in a layered fashion. It allows everyone to access the basic content and functionality of a web page, using any browser or Internet connection while also providing those with better bandwidth or more advanced browser software an enhanced version of the page”.
The only downside we see in the JQuery Mobile as an emerging javascript framework is that it is currently in an Alpha framework and thus carries some of the risks and challenges of alpha frameworks including: a) fast development lifecycles b) user interface bugs and c) often changes to core API requiring code rewriting. The good news is that JQuery Mobile is fast approaching Beta and a Release Candidate (“RC”) is on the horizon.
Further analysis and testing shows that the alpha release currently supports many of the modern smartphones which is the mainstay of the mobile web anyway.
iOS
Android
Blackberry 6
WebOS
Win Phone 7
There are a few complementary and competitive frameworks out there and to not mention any of them would be a disservice to. You may want to consider Sencha or JQtouch as an alternative and PhoneGap is a fantastic solution to wrap your JQuery Mobile website as native mobile application but that’s another post.
Enjoy Going Mobile with The Who on iTunes or watch it on YouTube.
The cloud and Platform-as-a-Service (PaaS) architecture has enabled a whole new breed of applications to fulfill a variety of both standard and custom requirements. In this post, I will write about so-called ‘edge applications’ in context of one of our real world deployments. We’ll define an ‘edge application’ as one that mixes and matches cloud services with co-location services that enable the application developer to control and directly manage the risk of the underlying security, data, or any other component or service of the stack one desiresThe one example we use is a digital asset management system we developed and continue to maintain for a client. The application is roughly broken up into the following components:
Web-based asset collection from suppliers (millions of photos ranging in size from 0.5 to 5 MBs each)
Image curation including meta-tagging, editing, categorization, and organization by client editors
Image publishing and distribution to a variety of channels including public and private (ie, lightboxes)
End user consumption via web, email, and FTP
Basic and advanced search
End user invoice creation and payment management
Client reporting
The application is about five years old so its fundamental architecture was developed before the cloud was a feasible option. The platform is a traditional Microsoft .NET web stack including redundant application layers, a high performing database, and an asset repository (image files) residing on a storage area network (“SAN”).
Over the last two years, we’ve been able to introduce two edge components into the application that leverage cloud services to drastically improve key components of the architecture, specifically distribution and storage.
Two years ago our client’s requirements drastically changed as our clients needed to begin heavily using a ‘distribute via FTP’ method. The data to be delivered increased roughly 100 fold over the course of a month and then began to be consistent in total volume per month thereafter. The system was not designed to support such an increase and consequently performance became an issue. This could have been addressed by procuring additional high performing servers and increasing the bandwidth at our co-location facility but we felt (and ultimately measured) that the peak demand was highly variable and needed significant resources (ie, up to 50 times our mean usage) for about 5% of the day, albeit a very important part of the day. We did not want to overextend capacity (translate that to ‘budget’) to be able to hit performance requirements over these short intervals. Our instinct and eventually our analysis, revealed there was a better way and ultimately Amazon Web Services enabled us to arrive at we believe to be the optimal solution.
We leveraged the EC2 cloud and it’s on-demand resource allocation to distribute hundreds of Gigabytes of data a day to paying clients across the globe in what is considered near real-time for this particular industry. The pay-as-you-go model meant that we incurred relatively high hourly charges over a very small timeframe which is in direct contrast to the traditional method of amortizing the costs of dedicated servers over their lifetime. In this case, it became simple Calculus as we simply needed to figure out the area under each curve to determine which solution should be implemented from a monetary standpoint. In this case, the cloud came out heavily in our favor.
Just as important as cost to us was performance. We’ve been able to bring down our mean-time to asset delivery to just under ten minutes from over an hour due to previous backlog queues associated with pulling assets off the SAN and our relatively modest pipes at the co-location facility. These two components coupled together were a win-win for us and the client—better performance at a fraction of the cost. In the end, two key aspects of cloud computing were important to us and they can roughly be defined as:
Unlimited bandwidth
Unlimited server capacity (processing and throughput)
In our case ‘unlimited’ simply means the ratio of what’s easily available to us in terms of bandwidth and server capacity compared to the resources we might need at any given time is extremely high, essentially unlimited. By programmatically bringing on resources at predetermined threshold levels and then dropping those resources when not needed, we’ve been able to closely match resource supply with actual demand ensuring that we do not:
Over invest in capacity thereby incurring high costs and
Under invest in capacity thereby not meeting delivery requirements
Once we had that win under our belt, we then realized our storage capabilities of our SAN were fast becoming scarce. After a relatively simple cost-benefit analysis, we’ve decided to migrate the assets from the SAN to cloud storage over the next several months. In this case, as in previous, we utilized AWS again. This time however, we levered the Simple Storage Service (“S3”) in order to remove the need to purchase and maintain yet another SAN. A pure $/GB of storage comparison was not enough to bring to the cost in favor of the cloud but the relative ease of backup storage, redundancy and the additional maintenance costs our client would have to pay turned the odds in S3’s favor as well as having a highly durable solution.
It’s worthwhile to note, that the core application server and database server, in this case a Microsoft SQL Server Enterprise 2005 database (an instance type not yet available on EC2) remains housed in our leased SAS70 Type II co-location facilities. Unlike the cloud, we can visit the facility on demand and our client is comfortable with access privileges to the hardware and software via our firewalls. Our database sits behind multiple firewalls which protect and secure the data within the database from any potential real or perceived contamination of data from shared or virtual environments. The database is regularly backed up, encrypted and then pushed over an encrypted channel to the S3 service for backup. In all cases, AWS’s .NET SDK was instrumental in programming and deploying out cloud management services.
Time will tell what and when other parts of the application are moved to the ‘edge’ but we’re sure glad we have that ‘real option’ available to us to make the move at any time.
As video content gains popularity across the web, a question our clients often ask is what should be their strategy with respect to the emerging medium? At Fusebox, we feel that best practices for content creation and delivery are based on the current and future needs of those users consuming it. That is, the content needs to be accessible and display appropriately on their devices. Put simply, a video strategy is just one component of an overall content strategy; albeit an increasingly important one. It is subject to the same framework one would generally associate with content strategy, namely the practice of planning the content creation, delivery, and governance to achieve business goals that maximize the impact of content. This may mean different things to different organizations but likely includes addressing the current and future state of a variety of activities that happen across the organization including:
Content analysis – Does the content exist or will it be created?
Creation and Editorial – Who needs to be involved in the creation and editing of content?
Software – What new tools might be needed?
Content Distribution – Where will assets be leveraged? Who can access the content?
LIfecycle = How long will the content remain relevant?
Change Management – How are changes implemented across the organization?
Great content that is not accessible is equally troublesome to an organization as poor content is everywhere. It’s particularly important when content is delivered that it is appropriately identified to end users, traditional search and semantic engines as well so that users and systems consuming the data understand the context and how it should be levered. Questions to be answered are often the following:
What format is the text and/or video in?
What subject matter does the content address?
Are there any key semantics the user should be aware of?
What related content might be of interest for the user and is it available?
Based on the consuming users needs what seemingly unrelated content might be relevant?
What access privileges does one need to view and edit the content?
While various reports suggest dissatisfaction with much of today’s video content, one needs to understand the core reasons why this happens and then systematically ameliorate the defects. People do like to watch video, in fact, business purchasers increased their consumption of video by 82% from 2008 to 2009, and then another 16% in 2010. It’s worthwhile to note that content producers increased their supply of video in roughly the same proportion as consumers seemed to demand it. Additionally, as of December 2011, it’s estimated that as much as 37% of the Internet is video based with no signs of a slowing down. Again, it is important to note that that amount of video needed to deliver the same amount of information that text can deliver is much greater. That is, information density (ie the amount of information per unit megabyte) is much lower in video than in the written word.
What has been a factor in the overall success or lack therin of much video content is both the production quality coupled with the increased expectations of the user for ‘Internet video’. Expectations have increased significantly since 2008. People don’t just want video, they want a good experience and a well produced video is often just one component of that. Production values need to increase in order to engage the consumer. What we do know is that when a consumer is engaged with interactive content there is a greater ability to retain and grow that customer than simply producing an equivalent non-interactive piece of content. Interactivity allows users to be more attentive to the video that they are watching especially when there is an ability to move non-linearly; either through navigation such as jumping from section-to-section or via interaction such as polling questions coherently integrated into the content. The incremental information exchange, along with the dynamics of interaction, provides value to both parties, at least as long as a commitment is made to follow-up by one or both parties.
Video also has the ability to reduce the amount of time one needs to view information as compared to reading. An analogy can be made to the book vs. movie debate. The book may take 13-25 hours to read yet the movie may only take 2 hours. The information gathered from the content is ‘nearly identical’ (we understand avid book readers will argue vehemently against this) and while the oft measured concern is that the book was far better than the movie, the general feedback is that the trade-off was net positive. To put in financial terms, the ROI of the movie exceeded the respective hurdle rates—and having both available was a boon to the business. A clear misuse of video, and one that is particularly rampant on the Internet in today’s paradigm, is to force the user into watching an extended video that could have been addressed with a document visually scanned in 5-10 minutes. In this case, the user’s trust was violated. Overall, the content was mismatched to the end users need, and the user will be leery in accessing future videos from the content publisher and possibly other comparable publishers.
In 2011 particular attention needs to be made on the production value of the video. It is no longer viable to simply rehash a white paper in video format and we believe much of the video content produced is simply due to the structural weaknesses of the organization. Our experience with our customers creating video and/or podcasts is that this may not be the most comfortable medium for those in front of the camera to connect with the audience. The writing skills of a companies content creators have been traditionally honed over many years and can be considered core strengths. In fact, this may have been a skill that largely led them to their current position. But are these content creators familiar with video, video production, editing, distribution, public speaking, and often acting? Even if the creator is comfortable speaking in front of potentially large groups it does not necessarily translate into an engaging video podcast where the talents of many may be needed.
This is where video production has the ability to change the game and what digital agencies like Fusebox can help provide. Engaging with an agency is an effective way for organizations to get started with video as the agency can provide a film crew, script writing, pre and post production, lighting, content and editing and set up consistent processes for an organization to repeatably produce great video content. Further, agencies are likely able to develop, measure and analyze key performance indicators (KPIs) that can measure the impact and ROI of organization’s content strategies, but we’ll save that for Part II.
For you data Junkies out there, Linkedin launched a new tool, inMaps on linkedinlabs yesterday. This new tool helps you visualize your social graph by grouping people you are connected to and color codes them. For example it grouped all the past and current Fuseboxers into one color group, too bad you have to accept the default color scheme as I would have preferred the Fusebox group to be orange. It also identifies the influencers in your network by making their bubbles larger. Clicking on one of your contacts results in seeing all their connections. I’m looking forward to exploring my network a bit more in-depth. Check out my inMap.
Chardan Capital Markets provides a full suite of global investment banking services designed for micro, small and mid cap emerging growth companies. Chardan is also an industry leader in SPAC transactions and became one of the first firms to establish a presence in China.
Fusebox was retained to reposition, rebrand and redesign their website to better serve their customers and provide them with a competitive edge in the industry.
Fusebox helped streamline their business process by creating a website that could be self managed. Built on the Drupal open source platform we provided Chardan with a robust content management system. The new website features a custom “tombstone generator”, providing their team with tools to generate tombstones on the fly to display as deals are completed. A “How can Chardan help you?” wizard was developed to assist clients in determining which division would be most appropriate to contact for assistance. A robust user management system was developed that allows Chardan to publish their proprietary research content to existing clients and collect registration information from potential clients looking to retain Chardan for their expertise.
Together with BET Foundation, Fusebox is delighted to announce the launch of the redesigned BET Foundation Web site, the result of several months of close collaboration between these two organizations.
Fusebox’s design team created a fresh, light look and feel for the new Web site, incorporating appealing imagery reflective of the BET Foundation’s health focus and target audience. Our writers revised the site copy to establish a consistent tone and style and enhanced on-screen legibility. To help site visitors quickly locate the information they need, we reorganized all site content and introduced a new navigation scheme.
Our development team implemented the site in Drupal CMS to enable BET Foundation’s busy staff members to quickly update content with minimal training and no prior technical experience. The new site also features online registration and evaluation, complete with user management capabilities to allow BET’s staff to quickly and easily administer programs and events.
 , a fixed inner radius of the arc
  , and a fixed height of the pillar
  , determine the slicing point angle from the horizontal such that we will have four equal areas. Our slice is defined as the angle
  in degrees but in geometry it’s often more convient to work in
  radians.
 . Recalling high school mathematics, the arc length is simply a radius multiplied by the coverage angle in radians or simply
  . This proportion of entire area of a circular arc is simply the arc length divided by the circumference of the cirle or
  . Notice that the proportion is equal 1/4 the area of a circle when the angle is zero.
 and height of
 when we set
  . Expanding the equations, and then group by
 ![\alpha = [ \pi /4 (Ro^2 - Ri^2) - h(Ro - Ri) ] / (Ro^2 - Ri^2)](http://s0.wp.com/latex.php?latex=%5Calpha+%3D+%5B+%5Cpi+%2F4+%28Ro%5E2+-+Ri%5E2%29+-+h%28Ro+-+Ri%29+%5D+%2F+%28Ro%5E2+-+Ri%5E2%29&bg=ffffff&fg=000&s=0&c=20201002)
 , we find that
  degrees.
  and
and  degrees only.
 . Here’s the sketch. Put your answer in the comments if you dare for the same geometry. I’ll post our answer on Friday. 🙂